Build / Data science
Storm analysis notebook
Storm type counts and live weather in pandas, charted in a notebook.
Pythonpandasmatplotlib
What it does
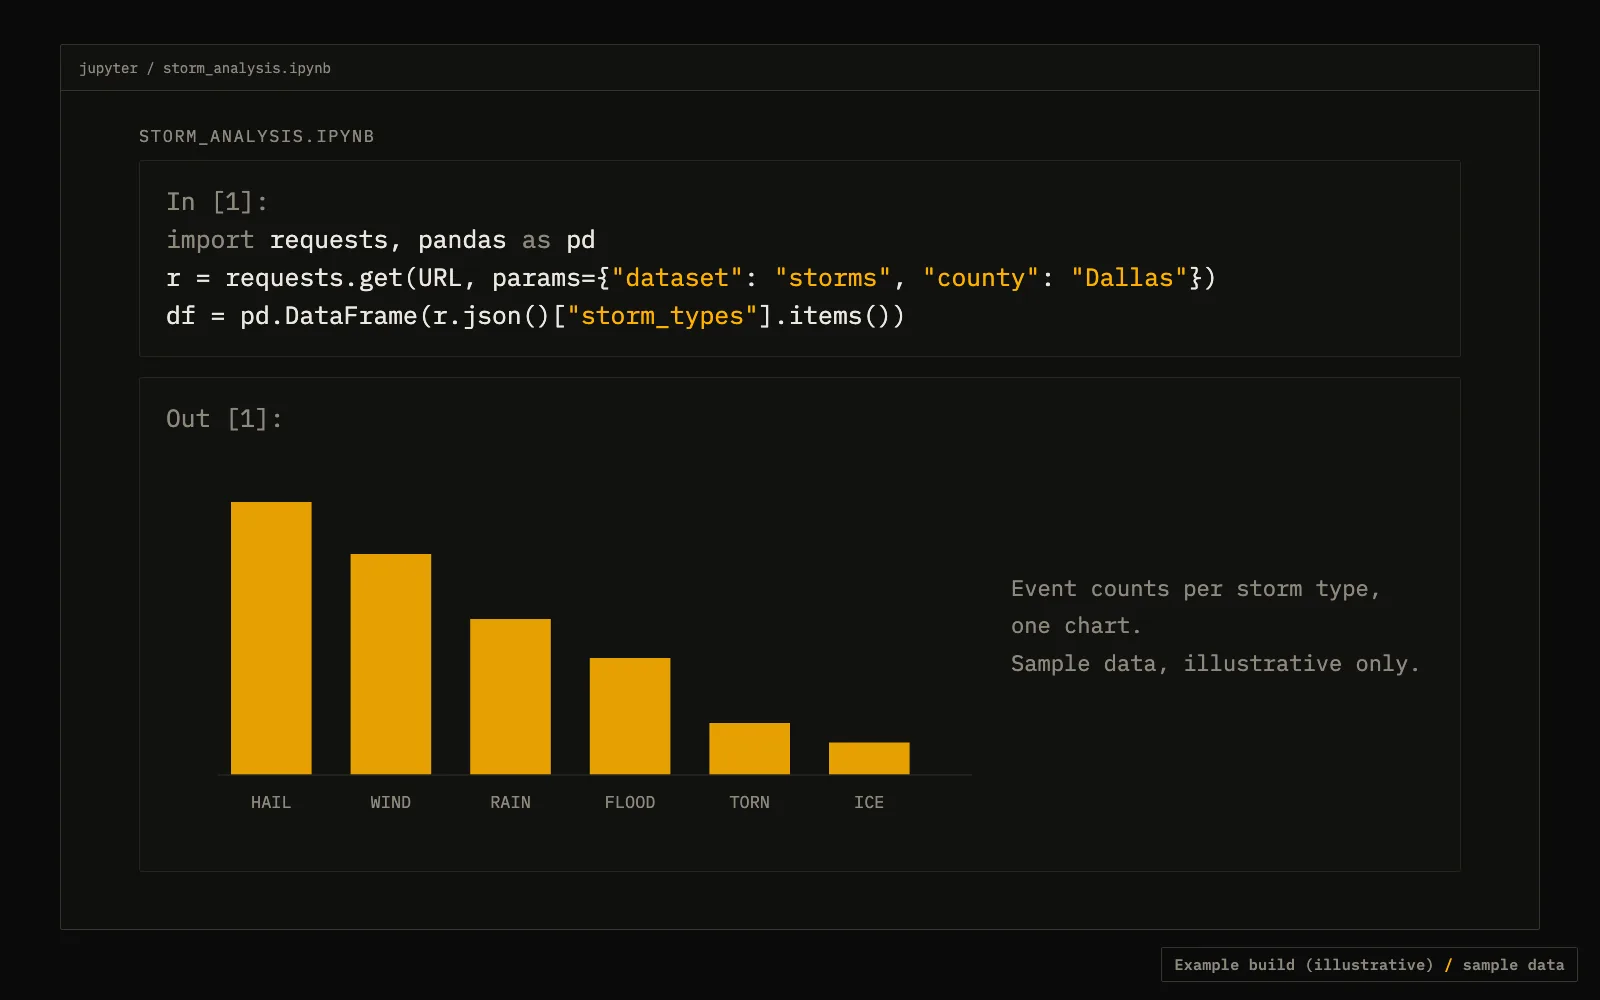
Take the free storm preview for a county, turn the storm type counts into a DataFrame, plot them. Add live weather for a list of points when you want conditions next to it.
- storm_types counts are per event, so they can sum higher than the address total.
- History back to 2003 is available through dataset=history.
API calls
Set your key once: export TFX_KEY=tfx_live_.... Free previews need no key.
Free: storm types for a county
curl "https://data.truefixr.com/v1/data?dataset=storms&county=Dallas&state=TX"
Live weather for many points
curl -X POST -H "Authorization: Bearer $TFX_KEY" -H "Content-Type: application/json" -d '{"locations":[{"lat":30.27,"lon":-97.74}]}' https://data.truefixr.com/v1/weather/batchCode (Python)
Cut down on purpose. Print the real response keys on your first call before you map fields.
import requests
import pandas as pd
import matplotlib.pyplot as plt

API = "https://data.truefixr.com/v1/data"

r = requests.get(API, params={"dataset": "storms", "county": "Dallas", "state": "TX"}, timeout=30)
r.raise_for_status()
types = r.json().get("storm_types", {})

df = pd.DataFrame(sorted(types.items(), key=lambda kv: -kv[1]), columns=["storm_type", "events"])
print(df)

ax = df.plot.bar(x="storm_type", y="events", legend=False, figsize=(8, 4))
ax.set_ylabel("events")
ax.set_title("Reported and radar-detected storm events by type")
plt.tight_layout()
plt.show()