Build / Dashboards
County risk heatmap
Rank counties by exposure and color a map by county forecast grade. Runs on the free daily digest.
TypeScriptdaily datasetSVG
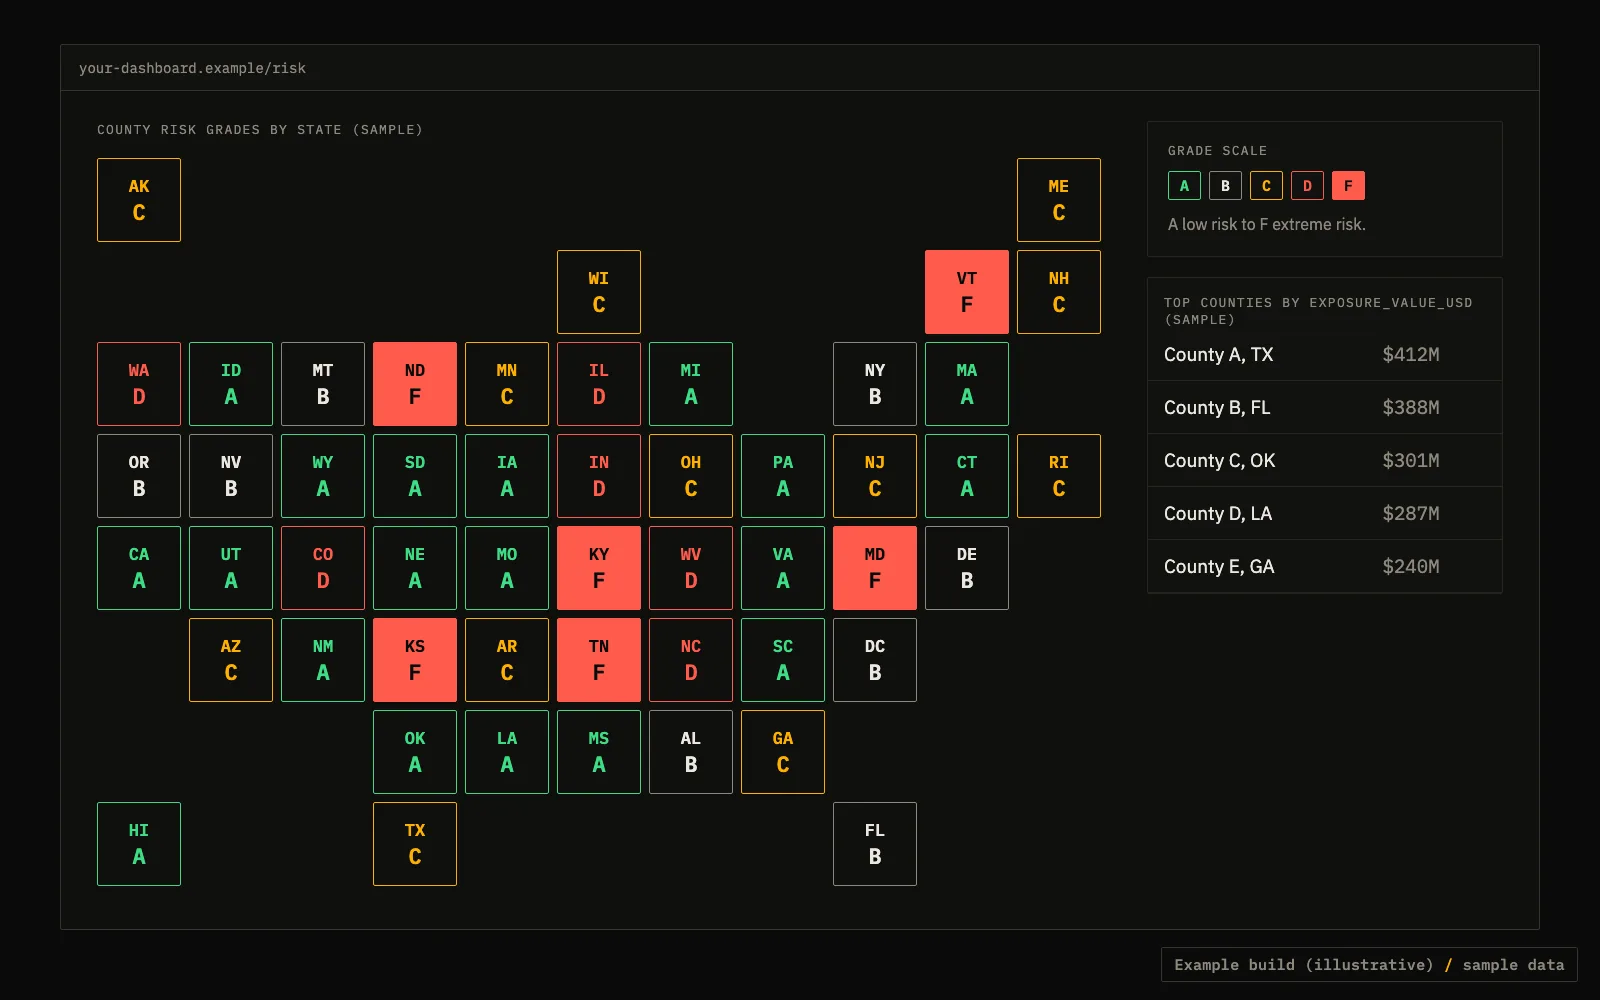
What it does
The daily county digest is free. It lists counties with new lead counts, storm types, exposure value and exposure people. Rank it, color your own map, and pay only when you pull addresses for a county you care about.
- Grades run A (low risk) to F (extreme risk).
- State and county names follow the API's own coverage list: GET dataset=coverage is free.
API calls
Set your key once: export TFX_KEY=tfx_live_.... Free previews need no key.
Free: top 20 counties by exposure
curl "https://data.truefixr.com/v1/data?dataset=daily&rank=exposure_value_usd&limit=20"
Free: one county grade
curl "https://data.truefixr.com/v1/data?dataset=risk&county=Dallas&state=TX"
Code (TypeScript)
Cut down on purpose. Print the real response keys on your first call before you map fields.
type Row = {
  county: string;
  new_leads: number;
  exposure_value_usd: number;
  exposure_people: number;
};

async function topCounties(limit = 20): Promise<Row[]> {
  const url = new URL("https://data.truefixr.com/v1/data");
  url.searchParams.set("dataset", "daily");
  url.searchParams.set("rank", "exposure_value_usd");
  url.searchParams.set("limit", String(limit));
  const res = await fetch(url);
  if (!res.ok) throw new Error(`HTTP ${res.status}`);
  const body = await res.json();
  // the ranked response is flat; check the wrapper key on your first call
  return (Array.isArray(body) ? body : body.counties ?? []) as Row[];
}

const gradeColor: Record<string, string> = {
  A: "#3ddc84", B: "#8d897c", C: "#ffb000", D: "#ff5c4d", F: "#ff5c4d",
};

topCounties().then((rows) => console.log(rows.map((r) => r.county), gradeColor.C));